



In the modern enterprise ecosystem, Salesforce serves as the digital nervous system for sales, service, and marketing operations. Yet, for many organizations, the internal workings of their Salesforce Org remain a "black box." When a page loads slowly or a critical integration fails, teams are often forced into a reactive cycle of manual troubleshooting, relying on user complaints to surface issues that have already impacted the bottom line.
The release of the New Relic Salesforce Exporter marks a significant paradigm shift in how businesses manage their Salesforce environments. By unifying usage, performance, security, and limit-management metrics into a single observability platform, New Relic is empowering organizations to move from reactive maintenance to proactive optimization.
The Main Facts: What is the New Relic Salesforce Exporter?
At its core, the New Relic Salesforce Exporter is an open-source integration designed to funnel granular telemetry data from Salesforce directly into the New Relic platform. It eliminates the fragmentation that typically plagues CRM administration, where data regarding API calls, Apex execution, and user sessions are often siloed within Salesforce’s internal monitoring tools.
By centralizing this data, organizations gain a holistic view of their Salesforce health. The tool is not merely a logging mechanism; it is an observability engine. It allows technical teams—from DevOps engineers to Salesforce Administrators—to correlate CRM performance with the broader application stack. Whether an issue stems from a faulty Apex trigger or a bottleneck in the Lightning framework, the Exporter provides the signal-to-noise ratio necessary for rapid resolution.
Chronology: The Evolution of CRM Observability
The journey toward comprehensive Salesforce observability has been gradual. Historically, Salesforce provided Event Monitoring and System Logs, but these tools were often difficult to extract and visualize in real-time alongside other enterprise application data.
- Phase 1: The Reactive Era. Organizations relied on native Salesforce "Setup" menus and periodic health checks. Troubleshooting was manual, and visibility into user behavior was limited to what Salesforce provided in its standard reporting suite.
- Phase 2: The Middleware Shift. As businesses integrated Salesforce with complex API ecosystems, the need for third-party monitoring became clear. However, early solutions were often brittle and required significant custom engineering to maintain.
- Phase 3: The Observability Revolution (Current). With the launch of the New Relic Salesforce Exporter, the focus has shifted toward "Full-Stack Observability." By leveraging an open-source model and an automated installer tool, New Relic has democratized access to enterprise-grade telemetry, allowing companies to deploy sophisticated monitoring environments in minutes rather than weeks.
Supporting Data: The Four Pillars of Salesforce Optimization
The power of the New Relic integration lies in its ability to categorize telemetry into four actionable domains, each designed to address a specific business pain point.
1. Ensuring System Performance
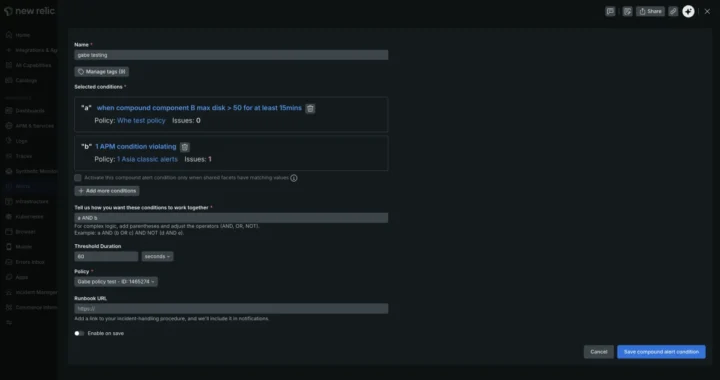
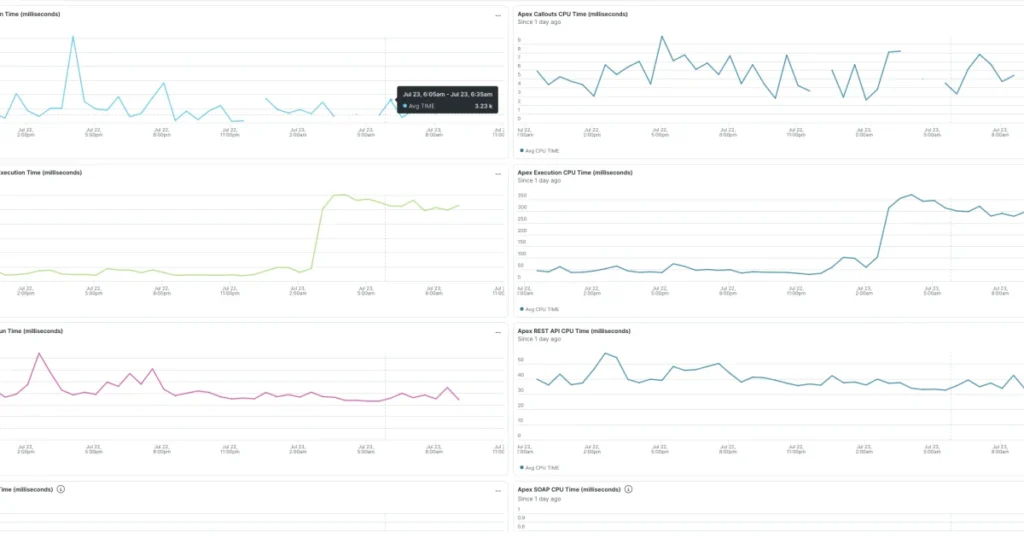
Performance degradation is a silent revenue killer. When Salesforce experiences latency, sales cycles stall and support tickets spike. New Relic’s proactive alerting system identifies performance bottlenecks—such as slow-running Apex classes or inefficient database queries—before they reach the end-user. By setting performance thresholds, IT teams can receive alerts via Slack, PagerDuty, or email, allowing them to rectify issues before a single user files a ticket.
2. Optimizing Critical User Journeys
The Lightning Experience is the backbone of the modern Salesforce user interface. However, complex customizations can lead to "heavy" pages that frustrate employees. The Exporter tracks Lightning usage metrics, allowing administrators to pinpoint high-latency interactions. By understanding exactly how users navigate the platform, companies can optimize workflows, streamline page layouts, and ultimately increase adoption rates across their sales and service departments.
3. Security and Compliance
Security in the cloud is a shared responsibility. The New Relic Salesforce Exporter provides real-time visibility into the security posture of an Org. It monitors:
- Login Anomalies: Detecting suspicious access patterns from unexpected locations.
- Permission Updates: Tracking changes to critical profiles or permission sets.
- CSP and CORS Violations: Identifying misconfigurations that could expose the organization to cross-site scripting attacks.
This persistent monitoring ensures that organizations stay ahead of both internal misconfigurations and external threats.
4. Managing Org Limits
Salesforce imposes "Governor Limits" to ensure fair resource allocation. Hitting these limits—whether they pertain to API requests, database storage, or concurrent Apex jobs—can lead to total business process failure. New Relic provides constant visibility into these thresholds. Instead of waking up to a system outage, administrators can use trend data to forecast capacity needs and scale their infrastructure accordingly.
Official Responses and Technical Foundations
To support these use cases, New Relic has doubled down on an open-source, community-driven approach. The integration is built upon two technical foundations: a robust Exporter architecture and an automated Installer Tool.
"We understand that your time is your most valuable asset," states the New Relic development team. This sentiment is reflected in the design of the Installer Tool. By utilizing a simple questionnaire, the tool handles the heavy lifting of:
- Generating configuration files.
- Deploying Docker-ready containers.
- Installing out-of-the-box dashboards that map directly to the KPIs mentioned above.
This modularity ensures that the solution is not a one-size-fits-all product, but a highly customizable framework that can scale from a small business Org to a global enterprise footprint.
Implications: The Future of Salesforce Administration
The introduction of this tool signals a fundamental change in the role of the Salesforce Administrator and the DevOps engineer.
From Admin to Architect
As the complexity of the Salesforce ecosystem grows, the role of the administrator is evolving into that of an architect. By utilizing New Relic’s data-driven approach, admins can move away from manual "button-clicking" troubleshooting and toward data-backed infrastructure optimization.
Economic Impact
The financial implications of improved observability are substantial. Downtime in Salesforce directly equates to lost billable hours for sales teams and delayed resolution times for service centers. By reducing Mean Time to Detection (MTTD) and Mean Time to Resolution (MTTR), organizations can protect their bottom line and maximize the ROI of their Salesforce licenses.
Cross-Departmental Transparency
Perhaps the most significant implication is the democratization of data. When Salesforce telemetry is ingested into a platform like New Relic, it sits alongside data from other enterprise systems. This allows for a "Single Source of Truth." For example, a business can now correlate a spike in Salesforce API errors with a deployment in their back-end middleware, identifying the root cause in seconds rather than hours of cross-departmental meetings.
Conclusion: Getting Started
The New Relic Salesforce Exporter is more than just a technical bridge; it is a strategic asset for any company that treats its CRM as a critical business component. By providing visibility into Apex usage, API access, Org limits, and security protocols, New Relic has removed the mystery from Salesforce management.
For organizations looking to eliminate the "black box" and embrace a proactive approach to CRM management, the path forward is clear:
- Audit current visibility: Identify the areas where your team currently lacks data.
- Leverage the Installer Tool: Use the provided GitHub resources to deploy the initial monitoring environment.
- Utilize Dashboards: Start with the out-of-the-box templates and customize them to fit your specific Org architecture.
In an era where digital experience is the primary differentiator, the ability to monitor, secure, and optimize your most vital business platform is no longer a luxury—it is a competitive necessity. Sign up for a New Relic account today or request a demo to see how your Salesforce Org can be transformed into a high-performance, fully observable machine.